
July 7, 2025
Market Update: June 30th, 2025
Welcome to the Monthly Market Update from Signature Wealth Management. I’m Brian Ransom, Research Director from Signature Wealth and here’s what happened in the market this month.
We just had a very good month of June. This follows a 19% selloff to start the year. But 3 months and a +24% return later and we are back to all time high pricing in the S&P 500.
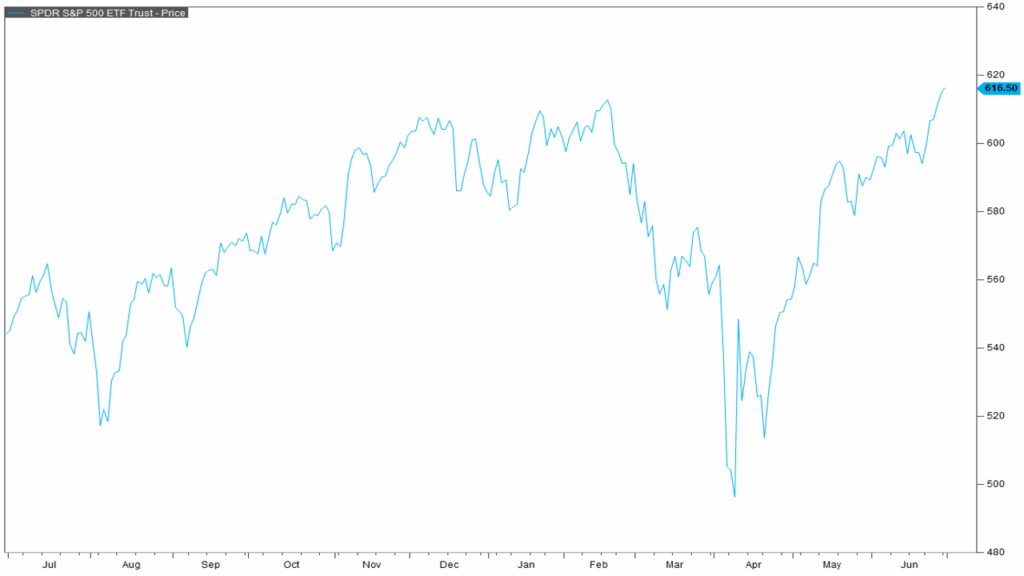
2025 is starting to look quite a bit like 2018. Back in 2018, we saw a 20% sell off in 57 days due to a trade war during the first Trump presidency. The recovery was V-shaped and we were back to all-time highs in 76 days. Here in 2025, we saw the 19% decline in 37 days followed by a 53 day recover to all-time highs.

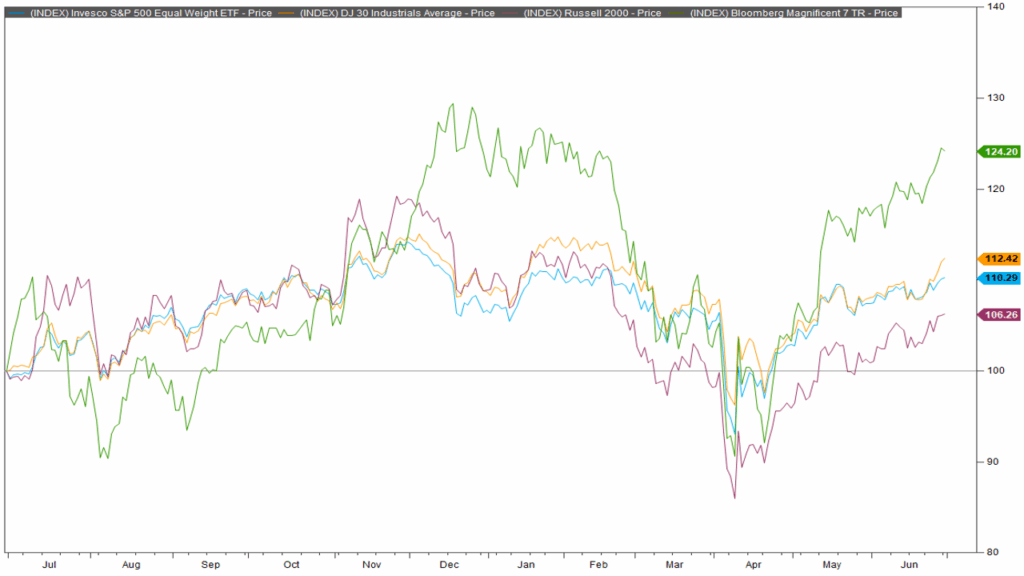
The recovery hasn’t been even, however. The equal weight S&P 500 shown in blue is well off it’s all time highs, The Dow Jones Industrial Average shown in orange is off it’s all time highs, the Russell 2000 shown in purple is off it’s highs, and even the Magnificent 7 shown in green is off it’s highs.
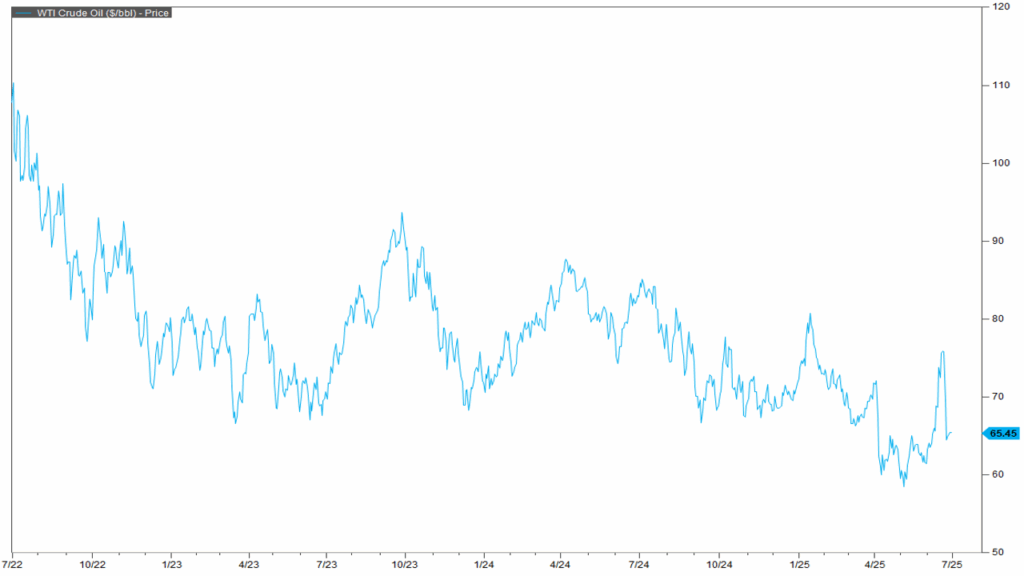
War in the Middle East caused a brief spike in crude oil prices this month. But easing tensions have effectively wiped out that spike and we are back down to $65/barrel.
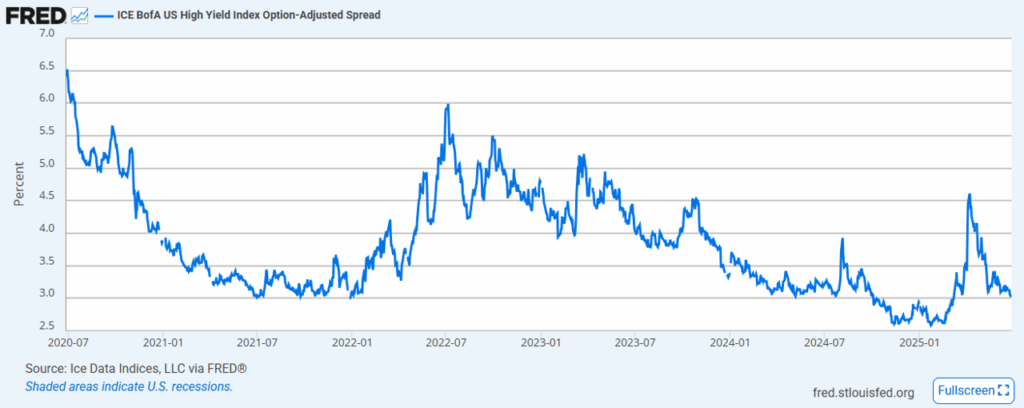
And back in April, we saw the spread on high yield bonds over treasuries spike in light of tariff issues. That spike has since dissipated back down to tighter levels indicated that bond investors are willing to take the risk on high yielding, lower quality bonds relative to treasuries. This is a positive sign for the economy.
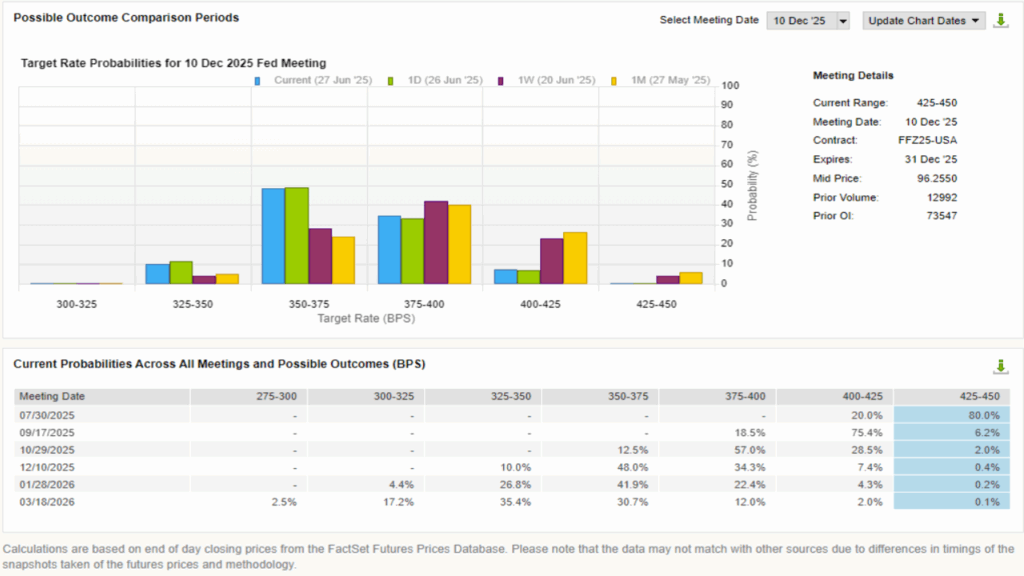
The market continues to be on Fed watch following the June Fed meeting where interest rates were held steady at 4.25%. But based on the latest economic data and some of the language from that meeting, we are seeing increasing odds of 2 or even 3 rate cuts on the back half of the year. This would ease monetary pressure on banks, businesses, and even the Treasury.
Thanks for joining for the monthly market update! We have a new podcast called “Business Tales.” You can find Business Tales on all your favorite podcasting apps. Also, our website is full of economic, financial planning, and market content. For those looking for more information please visit our website at signaturewmg.com. And don’t forget to like and subscribe.
Sources:
- FactSet Research Systems. (n.d.). S&P 500 (Interactive Charts). Retrieved June 30, 2025, from FactSet Database.
- FactSet Research Systems. (n.d.). S&P 500 2025 & 2018 (Interactive Charts). Retrieved June 30, 2025, from FactSet Database.
- FactSet Research Systems. (n.d.). RSP, Magnificent 7, DJI, Russell 2000 (Interactive Charts). Retrieved June 30, 2025, from FactSet Database.
- FactSet Research Systems. (n.d.). WTI Spot Price (Interactive Charts). Retrieved June 30, 2025, from FactSet Database.
- Ice Data Indices, LLC, ICE BofA US High Yield Index Option-Adjusted Spread [BAMLH0A0HYM2], retrieved from FRED, Federal Reserve Bank of St. Louis; https://fred.stlouisfed.org/series/BAMLH0A0HYM2, June 30, 2025.
- FactSet Research Systems. (n.d.). Policy Rate Tracker (Markets). Retrieved June 30, 2025, from FactSet Database.
Disclosures:
Signature Wealth Management Group is registered as an investment adviser with the SEC. Signature Wealth only transacts business in states where it is properly registered, or is excluded or exempted from registration requirements.
Information presented is believed to be factual and up-to-date, but we do not guarantee its accuracy and it should not be regarded as a complete analysis of the subjects discussed. All expressions of opinion reflect the judgment of the author as of the date of publication and are subject to change.
Information contained herein does not involve the rendering of personalized investment advice, but is limited to the dissemination of general information.
The Standard & Poor’s 500 (S&P 500) is an unmanaged group of securities considered to be representative of the stock market in general.
Always consult an attorney or tax professional regarding your specific legal or tax situation.
Our US Trade Policy Uncertainty Index is a daily version of one of the category-specific Economic Policy Uncertainty (EPU) indexes developed in “Measuring Economic Policy Uncertainty” by Scott R. Baker, Nick Bloom and Steven J. Davis. It reflects the frequency of articles in American newspapers that discuss policy-related economic uncertainty and also contain one or more references to trade policy. For index construction details, please visit the US Categorical EPU Indices page.
The 20-year Treasury bond is a long-term debt security issued by the U.S. Treasury Department that matures in 20 years.
The Russell 2000® Index measures the performance of the small-cap segment of the US equity universe. The Russell 2000 Index is a subset of the Russell 3000® Index representing approximately 7% of the total market capitalization of that index, as of the most recent reconstitution. It includes approximately 2,000 of the smallest securities based on a combination of their market cap and current index membership.
The Dow Jones Industrial Average is a price-weighted average of 30 significant stocks traded on the New York Stock Exchange and the NASDAQ. The DJIA was invented by Charles Dow back in 1896.
Past performance does not guarantee future results. Consult your financial professional before making any investment decision.
Forward-looking statements are not guarantees, and they involve risks, uncertainties and assumptions. The use of words such as “will”, “may”, “could”, “should”, and “would”, as well as any other statement that necessarily depends on future events, are intended to identify forward-looking statements.
Information is not an offer to buy or sell, or a solicitation of any offer to buy or sell the securities mentioned herein.
The S&P U.S. Style Indices measure the performance of U.S. equities fully or partially categorized as either growth or value stocks, as determined by Style Scores for each security. The Style series is weighted by float-adjusted market capitalization (FMC), and the Pure Style index series is weighted by Style Score subject to the rules described in Index Construction.
All information presented prior to an index’s Launch Date is hypothetical (back-tested), not actual performance. The Index returns shown do not represent the results of actual trading of investable assets/securities. S&P Dow Jones Indices LLC maintains the Index and calculates the Index levels and performance shown or discussed, but does not manage actual assets. Please refer to the methodology paper for the Index, available at www.spdji.com for more details about the index, including the manner in which it is rebalanced, the timing of such rebalancing, criteria for additions and deletions, as well as all index calculations.