
August 1, 2025
Market Update: July 29th, 2025
Welcome to the Monthly Market Update from Signature Wealth Management. I’m Brian Ransom, Research Director from Signature Wealth and here’s what happened in the market this month.
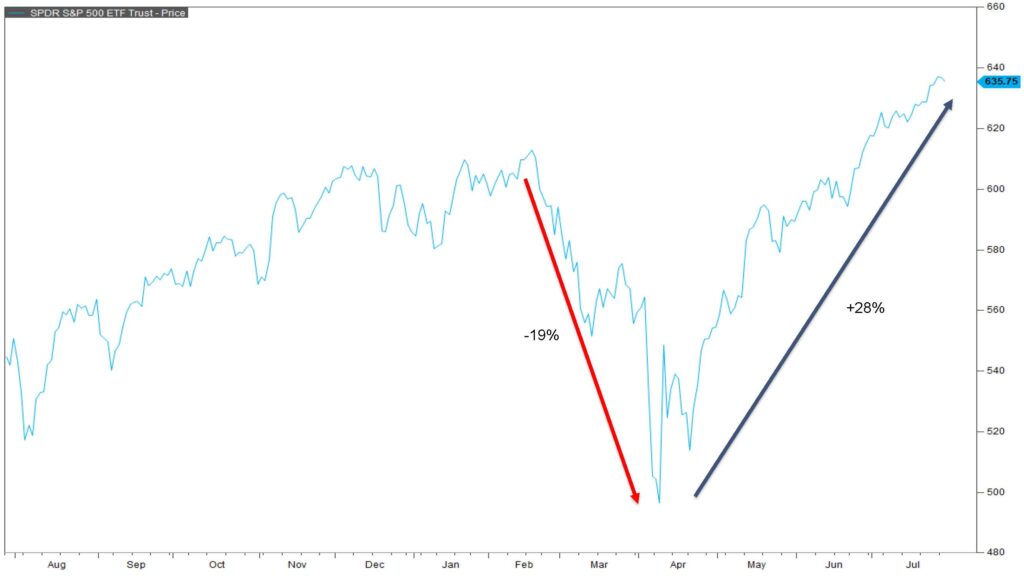
Fortunes in the market have completely reversed this summer relative to the spring. At the beginning of the year, the market peaked in February and fell significantly throughout the month of April. Since that April 8th bottom, however, the market is up nearly 28%.
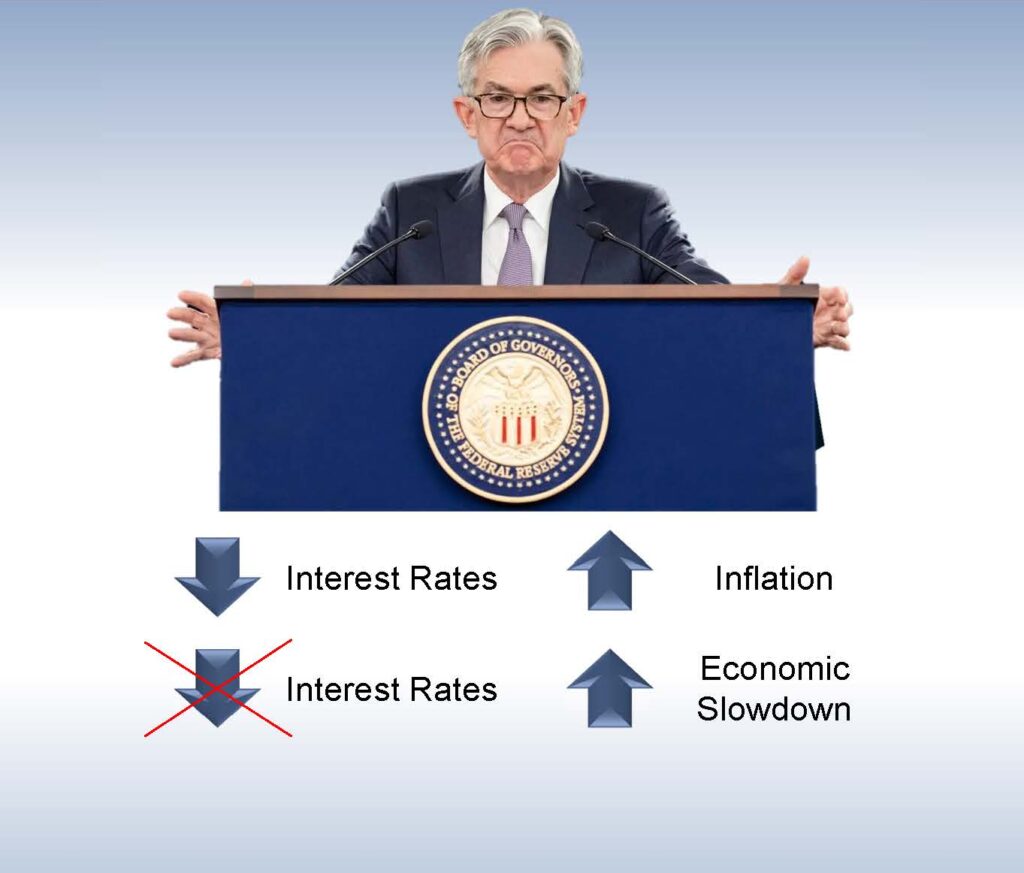
The primary question on everyone’s minds is what is the Federal Reserve and Chairman Powell going to do over the next few months? The situation is fairly binary. They could lower interest rates and risk reigniting inflation risks. Or then could not lower interest rates and increase the odds of an economic slowdown.
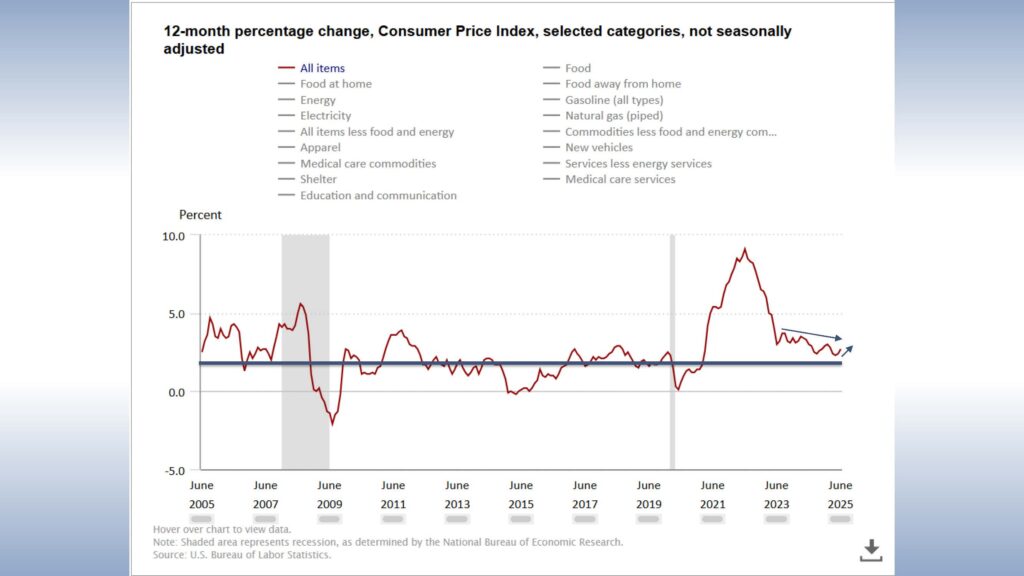
And here’s an update on those inputs starting with inflation. Shown here is year-over-year total CPI percentage change. The Federal Reserve successfully reduced inflation relatively quickly from 9% to around 3.5%. But the final mile is always the hardest. While inflation has continued to trend down since the summer of 2023, we have yet to hit that coveted 2% inflation target and inflation has actually started to tick up these last couple of months.
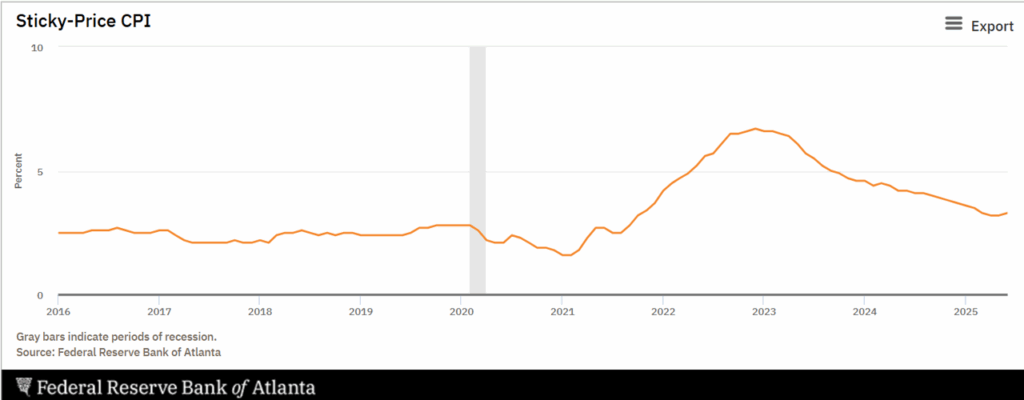
Looking at sticky-price CPI, these are price changes that are almost always permanent and are indicative of systematic, forward-looking inflation, we have seen sticky CPI fall since 2023. But for the first time since the peak, we have seen a 2-month increase in sticky CPI indicating that inflationary conditions remain embedded in the economy.
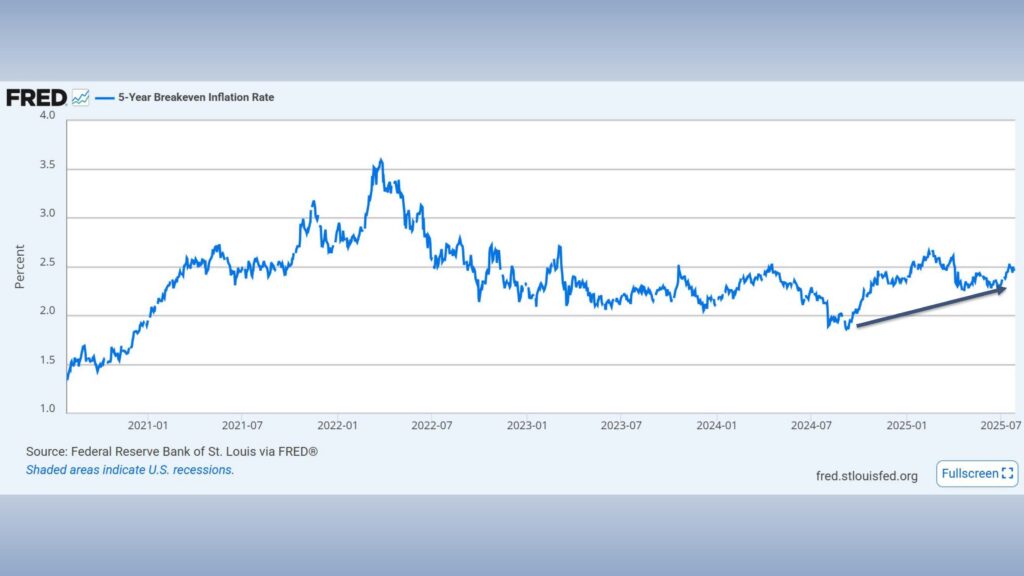
This has resulted in a small general increase in 5-year breakeven inflation increasing modestly over the last year. Breakeven inflation is the 5-year expected inflation rate given market conditions in the bond market and we currently sit at 2.5%.
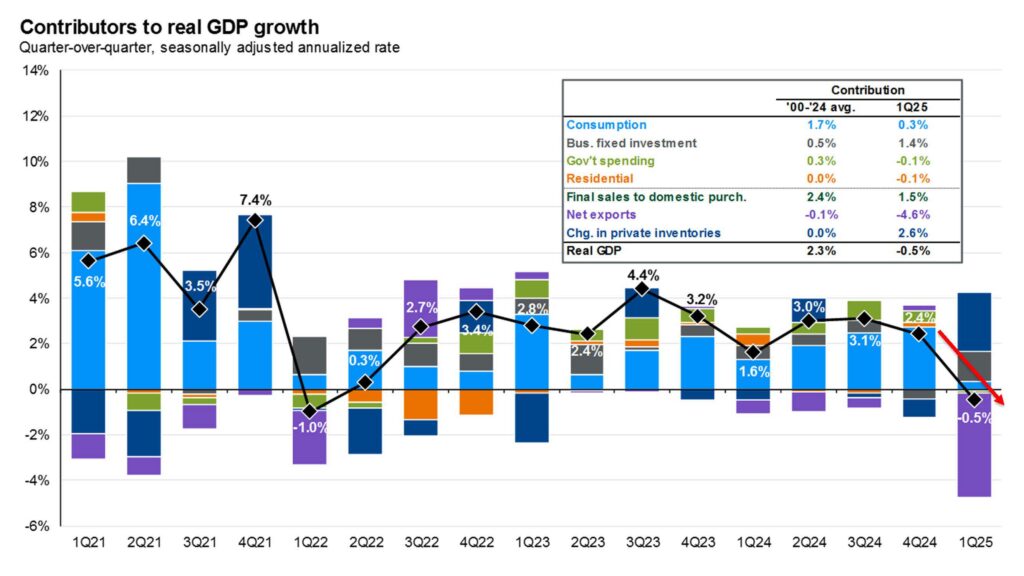
On the flip side of that, unemployment has started to rise indicating weakness in the labor market. Likewise, we have seen real GDP growth falter in the first quarter of 2025. While this GDP growth figure is distorted by net exports and is likely to rebound in the second quarter, rising unemployment and falling real GDP are good reasons to lower interest rates.
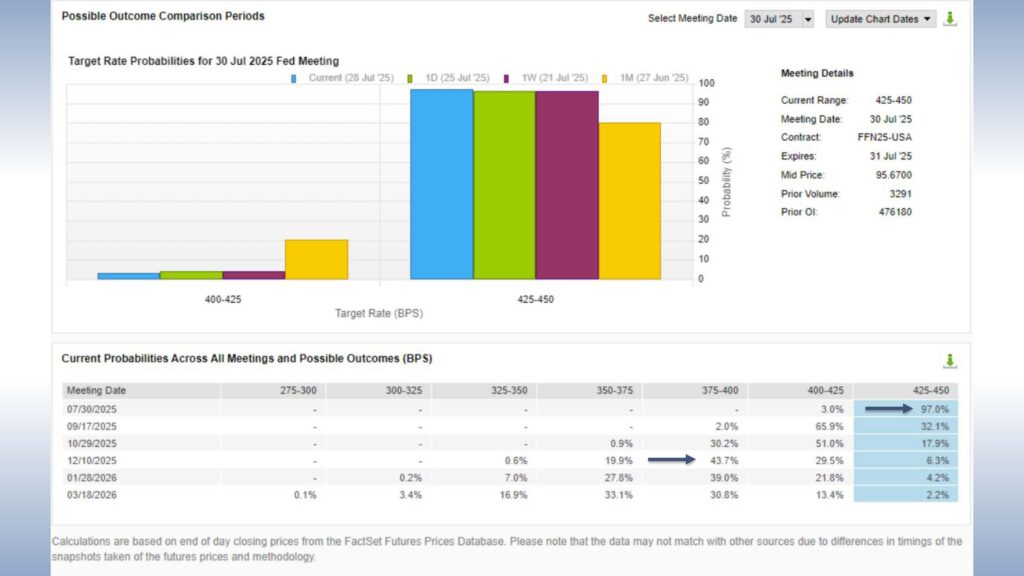
But as it stands currently, the market is pricing in 2 rate cuts by the Fed meeting on December 10, 2025. And by the time you all watch this video, we will have had our July Fed meeting for which the Fed very likely does NOT cut interest rates.
Thanks for joining for the monthly market update! We have a new podcast called “Business Tales.” You can find Business Tales on all your favorite podcasting apps. Also, our website is full of economic, financial planning, and market content. For those looking for more information please visit our website at signaturewmg.com. And don’t forget to like and subscribe.
Sources:
- FactSet Research Systems. (n.d.). S&P 500 (Interactive Charts). Retrieved July 29, 2025, from FactSet Database.
- U.S. Bureau of Labor Statistics. Graphics for Economic News Releases. “12-month percentage change, Consumer Price Index, selected categories”. Updated July 15, 2025. Retrieved from https://www.bls.gov/cpi/
- Federal Reserve Bank of Atlanta. Inflation Project. “Sticky-Price CPI.” Updated July 15, 2025. Retrieved from https://www.atlantafed.org/research/inflationproject/stickyprice
- U.S. Bureau of Labor Statistics, Unemployment Rate [UNRATE], retrieved from FRED, Federal Reserve Bank of St. Louis; https://fred.stlouisfed.org/series/UNRATE, July 29, 2025.
- J.P. Morgan Asset Management. “Guide to the Markets.” Slide 18 Components of GDP Growth. Updated June 30, 2025. Retrieved from https://am.jpmorgan.com/us/en/asset-management/protected/adv/insights/market-insights/guide-to-the-markets/
- Federal Reserve Bank of St. Louis, 5-Year Breakeven Inflation Rate [T5YIE], retrieved from FRED, Federal Reserve Bank of St. Louis; https://fred.stlouisfed.org/series/T5YIE, July 29, 2025.
- FactSet Research Systems. (n.d.). Policy Rate Tracker (Markets). Retrieved July 29, 2025, from FactSet Database.
Signature Wealth Management Group is registered as an investment adviser with the SEC. Signature Wealth only transacts business in states where it is properly registered, or is excluded or exempted from registration requirements.
Information presented is believed to be factual and up-to-date, but we do not guarantee its accuracy and it should not be regarded as a complete analysis of the subjects discussed. All expressions of opinion reflect the judgment of the author as of the date of publication and are subject to change.
Information contained herein does not involve the rendering of personalized investment advice, but is limited to the dissemination of general information.
The Standard & Poor’s 500 (S&P 500) is an unmanaged group of securities considered to be representative of the stock market in general.
Always consult an attorney or tax professional regarding your specific legal or tax situation.
Our US Trade Policy Uncertainty Index is a daily version of one of the category-specific Economic Policy Uncertainty (EPU) indexes developed in “Measuring Economic Policy Uncertainty” by Scott R. Baker, Nick Bloom and Steven J. Davis. It reflects the frequency of articles in American newspapers that discuss policy-related economic uncertainty and also contain one or more references to trade policy. For index construction details, please visit the US Categorical EPU Indices page.
The Consumer Price Index (CPI) is a measure that examines the weighted average of prices of a basket of consumer goods and services, such as transportation, food, and medical care. It is calculated by taking price changes for each item in the predetermined basket of goods and averaging them. Changes in the CPI are used to assess price changes associated with the cost of living.
Gross domestic product (GDP) is the total monetary or market value of all the finished goods and services produced within a country’s borders in a specific time period.
Past performance does not guarantee future results. Consult your financial professional before making any investment decision.
Forward-looking statements are not guarantees, and they involve risks, uncertainties and assumptions. The use of words such as “will”, “may”, “could”, “should”, and “would”, as well as any other statement that necessarily depends on future events, are intended to identify forward-looking statements.
Information is not an offer to buy or sell, or a solicitation of any offer to buy or sell the securities mentioned herein.
The S&P U.S. Style Indices measure the performance of U.S. equities fully or partially categorized as either growth or value stocks, as determined by Style Scores for each security. The Style series is weighted by float-adjusted market capitalization (FMC), and the Pure Style index series is weighted by Style Score subject to the rules described in Index Construction.
All information presented prior to an index’s Launch Date is hypothetical (back-tested), not actual performance. The Index returns shown do not represent the results of actual trading of investable assets/securities. S&P Dow Jones Indices LLC maintains the Index and calculates the Index levels and performance shown or discussed, but does not manage actual assets. Please refer to the methodology paper for the Index, available at www.spdji.com for more details about the index, including the manner in which it is rebalanced, the timing of such rebalancing, criteria for additions and deletions, as well as all index calculations.