
May 29, 2025
Market Update: May 27, 2025
Welcome to the Monthly Market Update from Signature Wealth Management. I’m Brian Ransom, Research Director from Signature Wealth and here’s what happened in the market this month.
The market has rebounded nicely following the 19% decline back in April. The S&P is up nearly 19% from the bottom as of May 27 and it does appear that the bear market caused by trade complications was short lived.
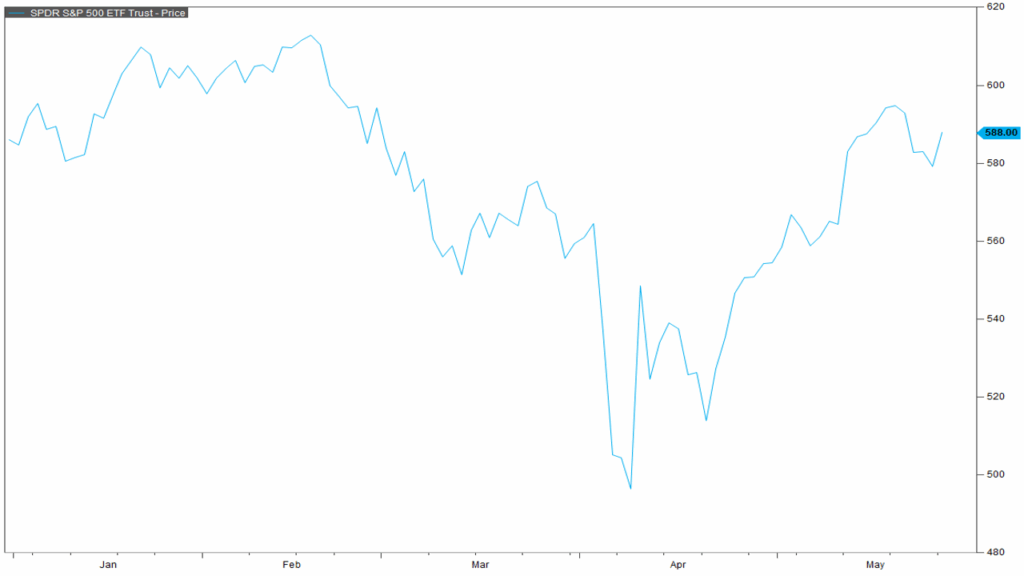
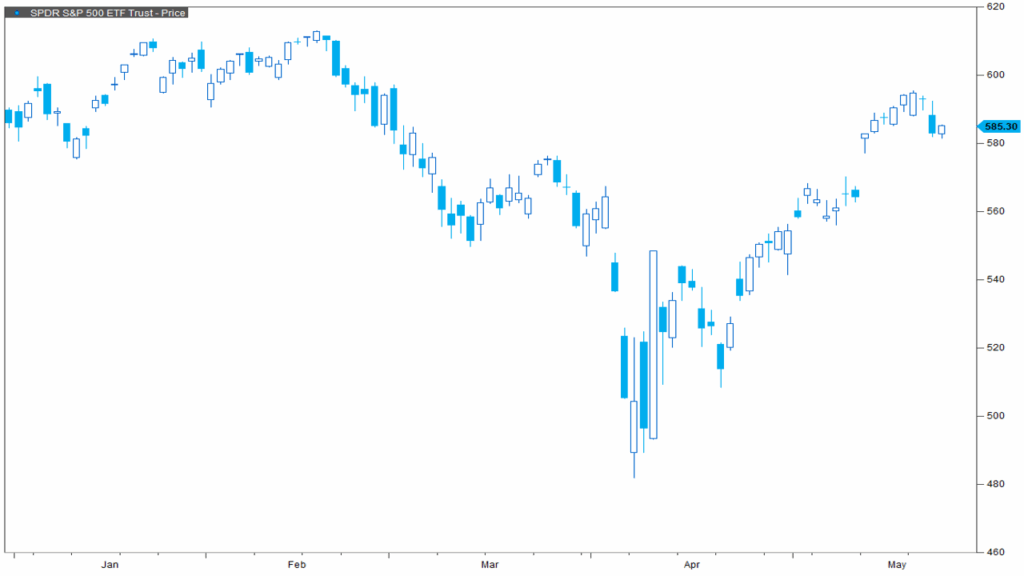
The big news item of the month was a credit downgrade on US sovereign debt from the credit agency, Moody’s. Moody’s is the last of the three major credit agencies to downgrade US debt. But largely, the market reaction was fairly muted to the credit downgrade.
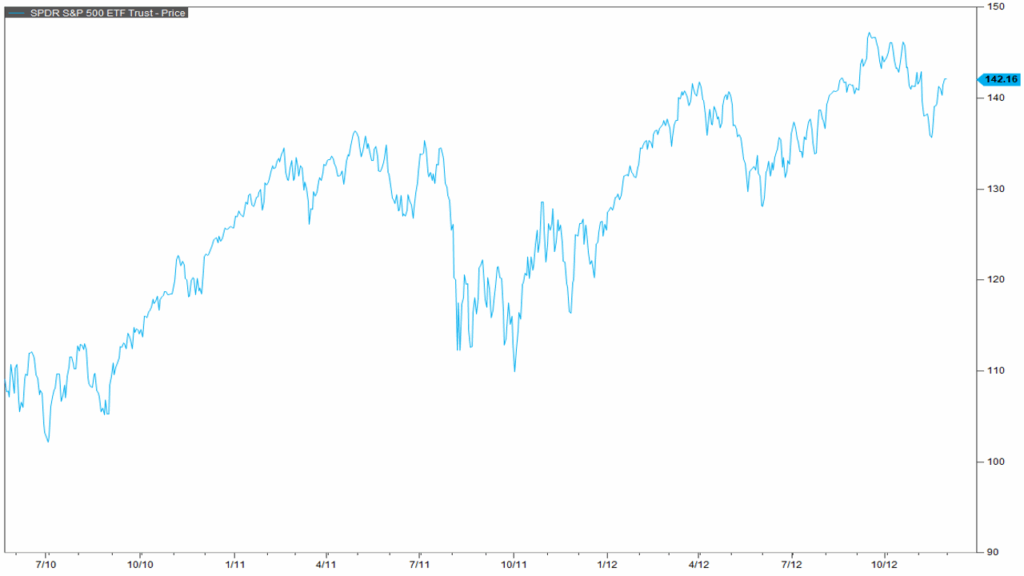
The first credit agency to downgrade US debt was S&P back in 2011. Back then, the credit downgrade came in the midst of the recovery from the Global Financial Crisis and was seen as a shock to the stock market. The subsequent Fitch downgrade in August 2023 was a non-market moving event and I would bet that most people don’t even remember the Fitch downgrade.
The quoted reason for the Moody’s downgrade is as such: “Successive US administrations and Congress have failed to agree on measures to reverse the trend of large annual fiscal deficits and growing interest costs. We do not believe that material multi-year reductions in mandatory spending and deficits will result from current fiscal proposals under consideration. Over the next decade, we expect larger deficits as entitlement spending rises while government revenue remains broadly flat. In turn, persistent, large fiscal deficits will drive the government’s debt and interest burden higher. The US’ fiscal performance is likely to deteriorate relative to its own past and compared to other highly-rated sovereigns.”
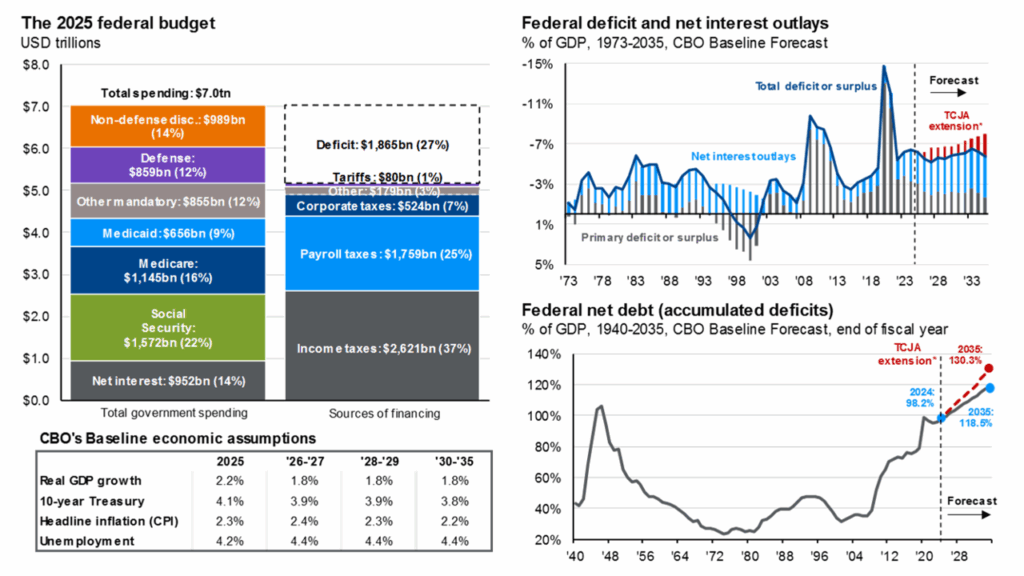
And this is essentially what Moody’s is referring to. The current Federal budget shows $1.865 trillion dollars in deficit spending relative to incoming revenue taxes. A big increase in spending has actually stemmed from rising interest rates which have increased debt servicing and is nearly $1 trillion in spending by itself. As the 2025 Congress continues to debate the future budget, extensions of the Tax Cuts and Jobs Act or TCJA are on the line. If the TCJA is extended, JP Morgan estimates the deficit spending will widen over the next 10 years resulting in federal net debt as a percent of GDP rising to 130% by 2035.
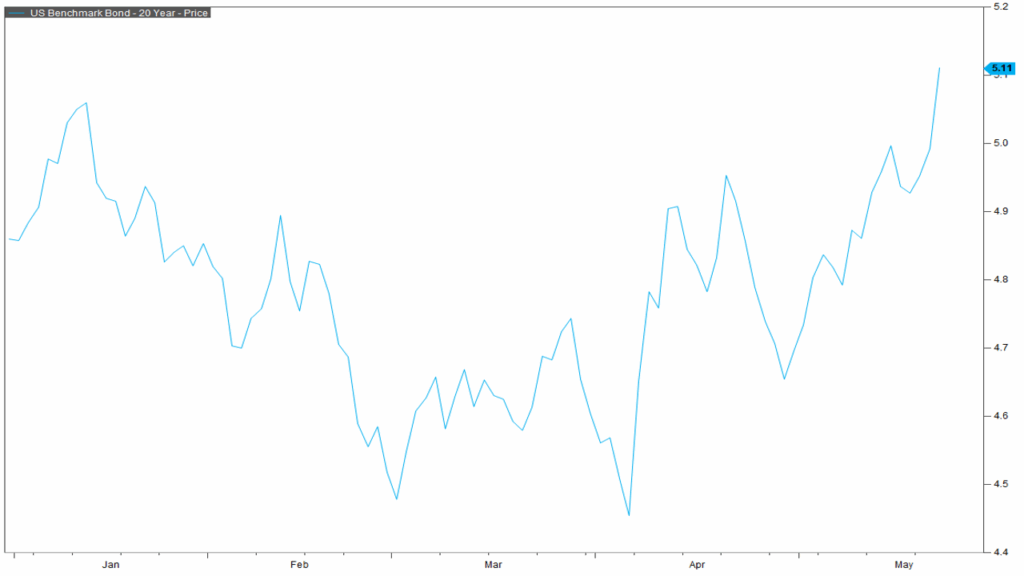
The combination of the Moody’s downgrade and the continued budget resolution process has resulted in a possible loss of confidence from bond investors in long term US treasuries. Shown here is a 20-Year treasury bond auction that occurred on May 21, 2025. During this auction, the treasury tendered $41 billion of bonds but investors only accepted $18 billion of those treasuries. This is a significant mismatch of supply of treasuries and demand from investors. The end result was a significant increase in 20-year treasury yields in the days following the auction. Importantly, it is critical that listeners not extrapolate the action in the treasury auctions to mean the loss of “reserve currency” status for the United States. This is simply a market reaction to important news out of Washington.
Thanks for joining for the monthly market update! We have a new podcast called “Business Tales.” You can find Business Tales on all your favorite podcasting apps. Also, our website is full of economic, financial planning, and market content. For those looking for more information please visit our website at signaturewmg.com. And don’t forget to like and subscribe.
Sources:
- FactSet Research Systems. (n.d.). S&P 500 (Interactive Charts). Retrieved May 27, 2025, from FactSet Database.
- FactSet Research Systems. (n.d.). S&P 500 (Interactive Charts). Retrieved May 22, 2025, from FactSet Database.
- Moody’s Ratings. “Moody’s Ratings downgrades United States ratings to Aa1 from Aaa; changes outlook to stable.” Released May 16, 2025. Retrieved from https://ratings.moodys.com/ratings-news/443154
- JP Morgan Asset Management. JP Morgan Guide to the Markets. Slide 23 “Federal Finances.” Updated April 30, 2025. Retrieved from https://am.jpmorgan.com/us/en/asset-management/protected/adv/insights/market-insights/guide-to-the-markets/
- Department of the Treasury. Bureau of the Fiscal Service. Treasury News: “Treasury Auction Results.” 20-Year Bond. Auction date: May 21, 2025. Retrieved from https://treasurydirect.gov/auctions/announcements-data-results/announcement-results-press-releases/
- FactSet Research Systems. (n.d.). 20 Year Treasury Yield (Interactive Charts). Retrieved May 22, 2025, from FactSet Database.
Disclosures:
Signature Wealth Management Group is registered as an investment adviser with the SEC. Signature Wealth only transacts business in states where it is properly registered, or is excluded or exempted from registration requirements.
Information presented is believed to be factual and up-to-date, but we do not guarantee its accuracy and it should not be regarded as a complete analysis of the subjects discussed. All expressions of opinion reflect the judgment of the author as of the date of publication and are subject to change.
Information contained herein does not involve the rendering of personalized investment advice, but is limited to the dissemination of general information.
The Standard & Poor’s 500 (S&P 500) is an unmanaged group of securities considered to be representative of the stock market in general.
Always consult an attorney or tax professional regarding your specific legal or tax situation.
Our US Trade Policy Uncertainty Index is a daily version of one of the category-specific Economic Policy Uncertainty (EPU) indexes developed in “Measuring Economic Policy Uncertainty” by Scott R. Baker, Nick Bloom and Steven J. Davis. It reflects the frequency of articles in American newspapers that discuss policy-related economic uncertainty and also contain one or more references to trade policy. For index construction details, please visit the US Categorical EPU Indices page.
The 20-year Treasury bond is a long-term debt security issued by the U.S. Treasury Department that matures in 20 years.
Past performance does not guarantee future results. Consult your financial professional before making any investment decision.
Forward-looking statements are not guarantees, and they involve risks, uncertainties and assumptions. The use of words such as “will”, “may”, “could”, “should”, and “would”, as well as any other statement that necessarily depends on future events, are intended to identify forward-looking statements.
Information is not an offer to buy or sell, or a solicitation of any offer to buy or sell the securities mentioned herein.
The S&P U.S. Style Indices measure the performance of U.S. equities fully or partially categorized as either growth or value stocks, as determined by Style Scores for each security. The Style series is weighted by float-adjusted market capitalization (FMC), and the Pure Style index series is weighted by Style Score subject to the rules described in Index Construction.
All information presented prior to an index’s Launch Date is hypothetical (back-tested), not actual performance. The Index returns shown do not represent the results of actual trading of investable assets/securities. S&P Dow Jones Indices LLC maintains the Index and calculates the Index levels and performance shown or discussed, but does not manage actual assets. Please refer to the methodology paper for the Index, available at www.spdji.com for more details about the index, including the manner in which it is rebalanced, the timing of such rebalancing, criteria for additions and deletions, as well as all index calculations.
